Airline passenger satisfaction Analytics using Microsoft powerBi

I am a Data Analyst and also a YouTube content creator
Data anaytics portfolio team 3
It's the fourth week of our amazing journey in Side Hustle Portfolio Bootcamp, and as usual, we've been assigned another amazing project to work on. This week, we set out to decipher the airline passenger satisfaction survey
Content
Gender: Gender of the passengers (Female, Male)
Age: The actual age of the passengers
Type of Travel: Purpose of the flight of the passengers (Personal Travel, Business Travel)
Class: Travel class in the plane of the passengers (Business, Eco, Eco Plus)
Flight distance: The flight distance of this journey
Inflight wifi service: Satisfaction level of the inflight wifi service (0:Not Applicable;1-5)
Departure/Arrival time convenient: Satisfaction level of Departure/Arrival time convenient
Ease of Online booking: Satisfaction level of online booking
Gate location: Satisfaction level of Gate location
Food and drink: Satisfaction level of Food and drink
Online boarding: Satisfaction level of online boarding
Seat comfort: Satisfaction level of Seat comfort
Inflight entertainment: Satisfaction level of inflight entertainment
On-board service: Satisfaction level of On-board service
Leg room service: Satisfaction level of Leg room service
Baggage handling: Satisfaction level of baggage handling
Check-in service: Satisfaction level of Check-in service
Inflight service: Satisfaction level of inflight service
Cleanliness: Satisfaction level of Cleanliness
Departure Delay in Minutes: Minutes delayed when departure
Arrival Delay in Minutes: Minutes delayed when Arrival
Satisfaction: Airline satisfaction level(Satisfaction, neutral or dissatisfaction)
Step 1 : Downloading of data
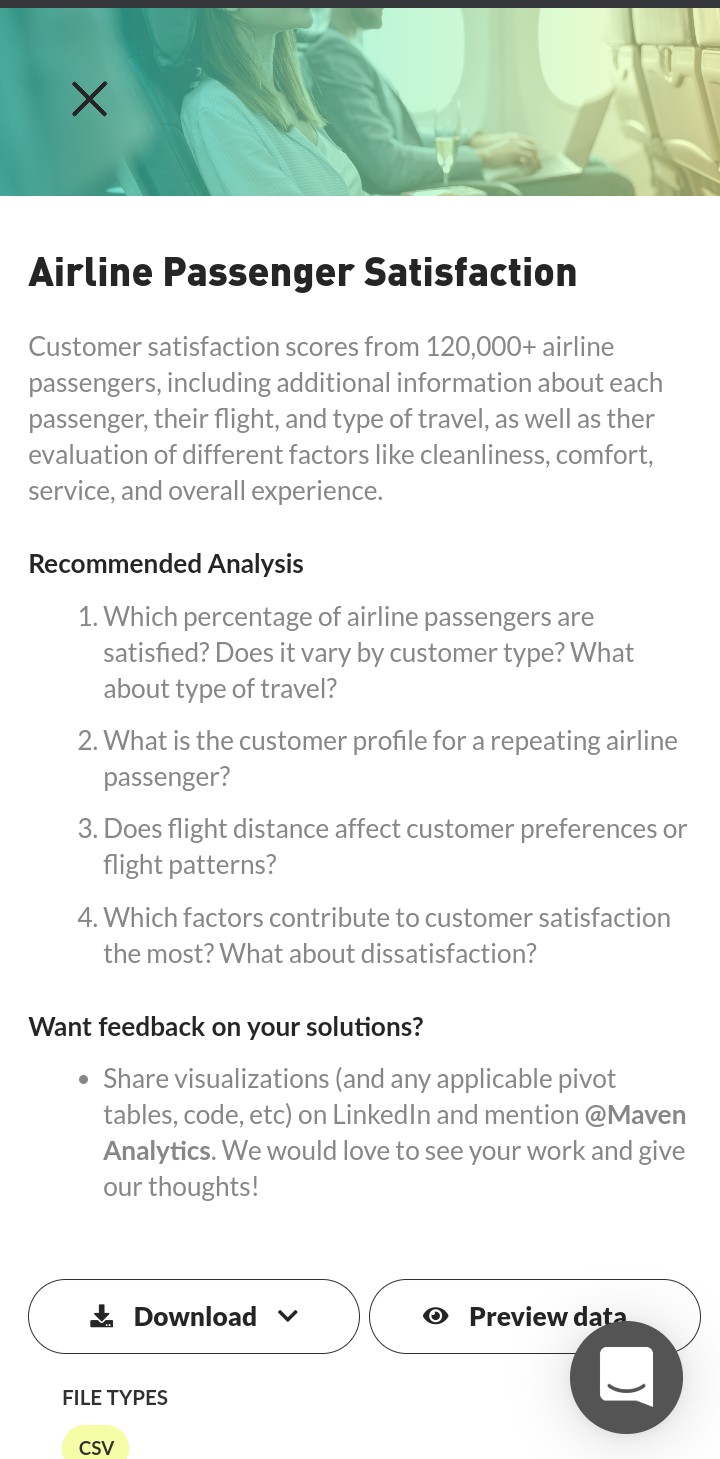
Download data here
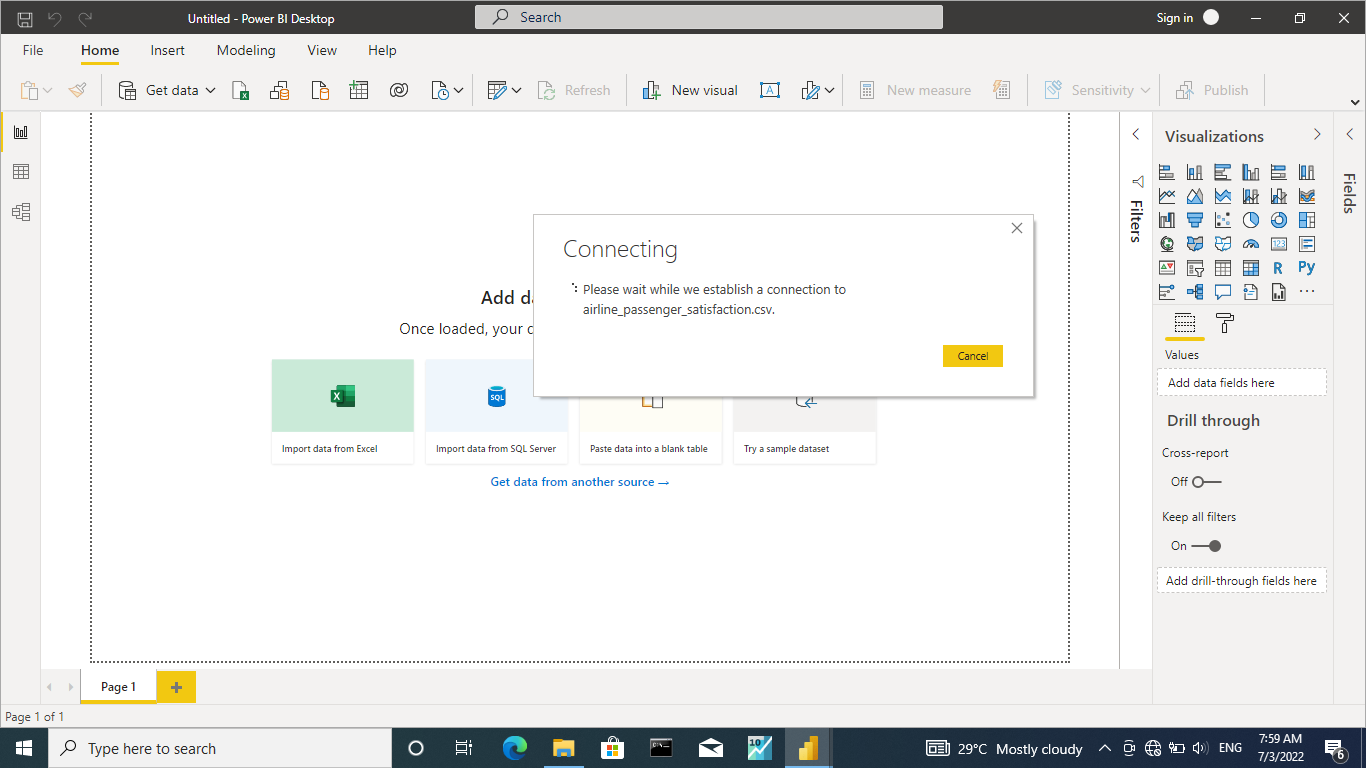
Step 2 : Importing the downloaded csv file "Airline passenger satisfaction" into Microsoft powerBi
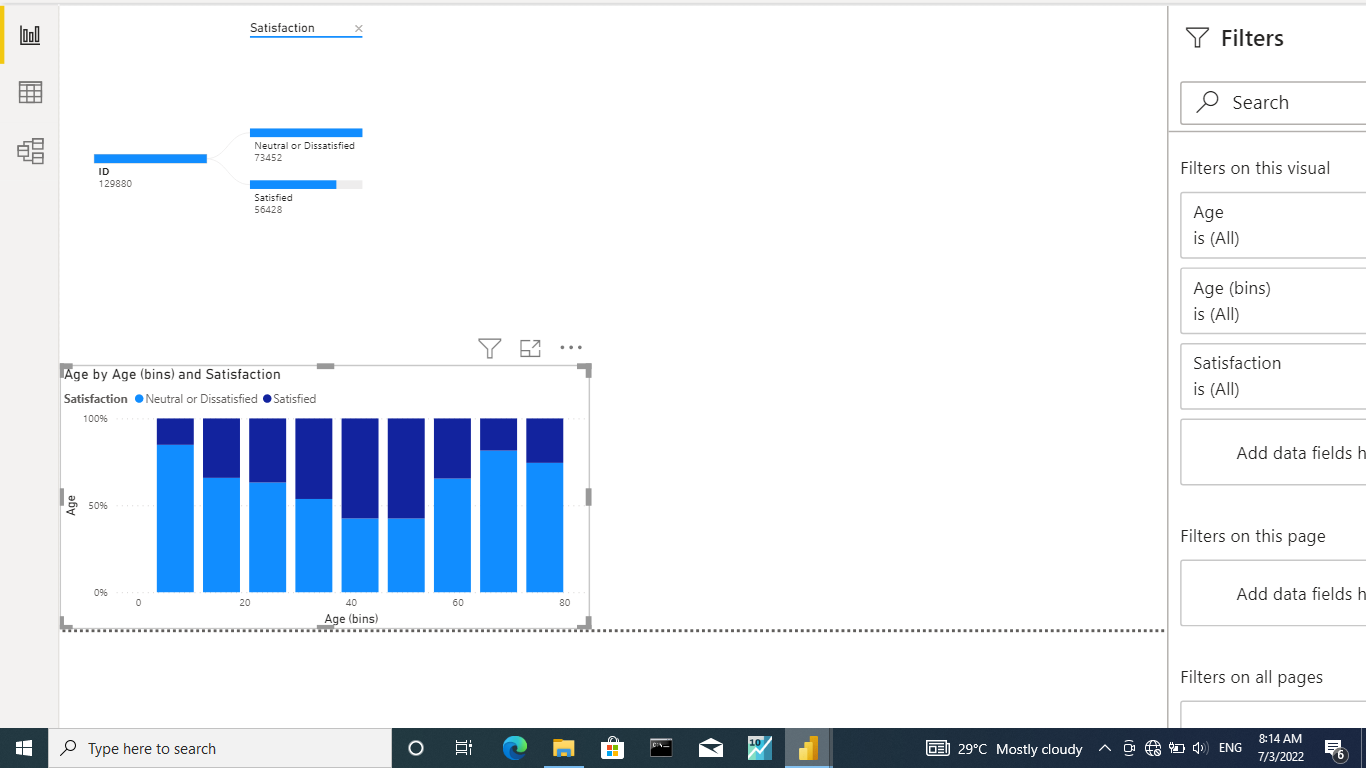
Step 3 : we used decomposition tree to show the total number of dissatisfied and satisfied passenger
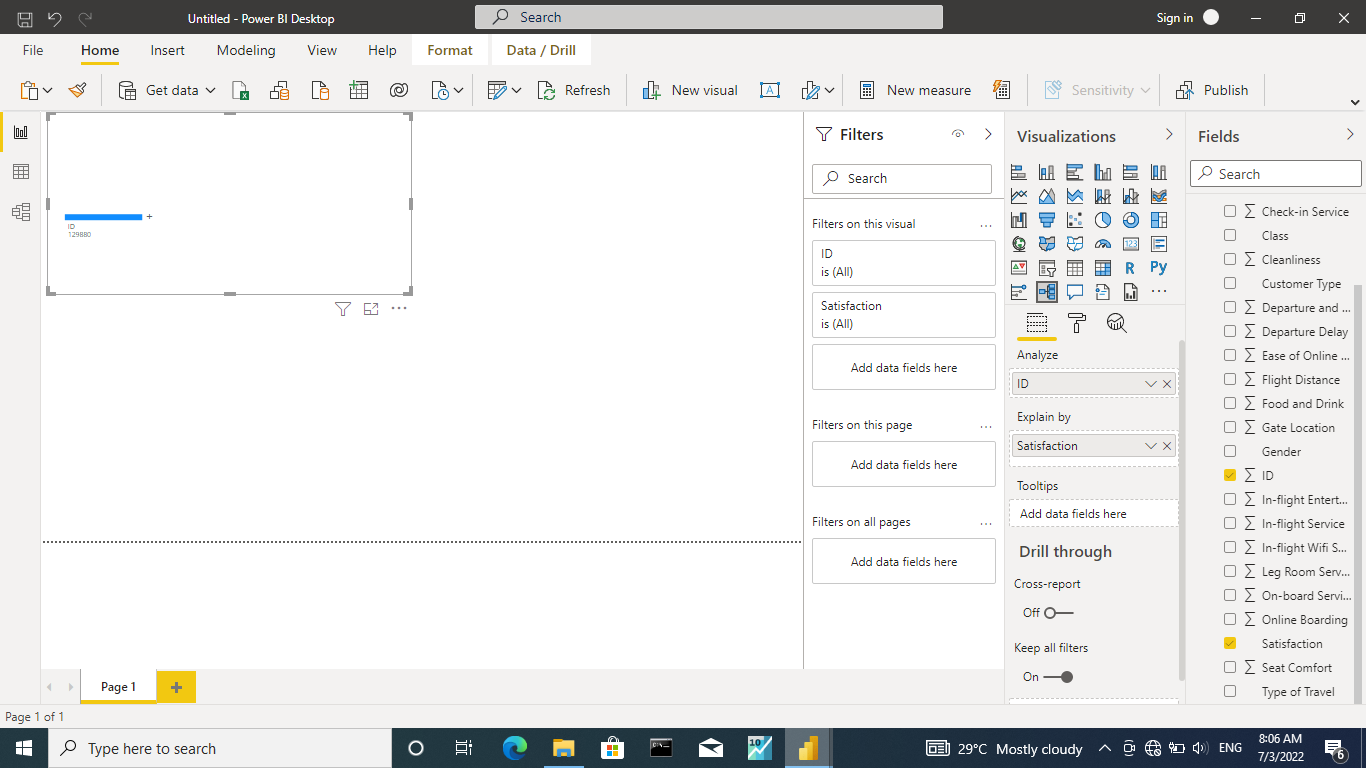
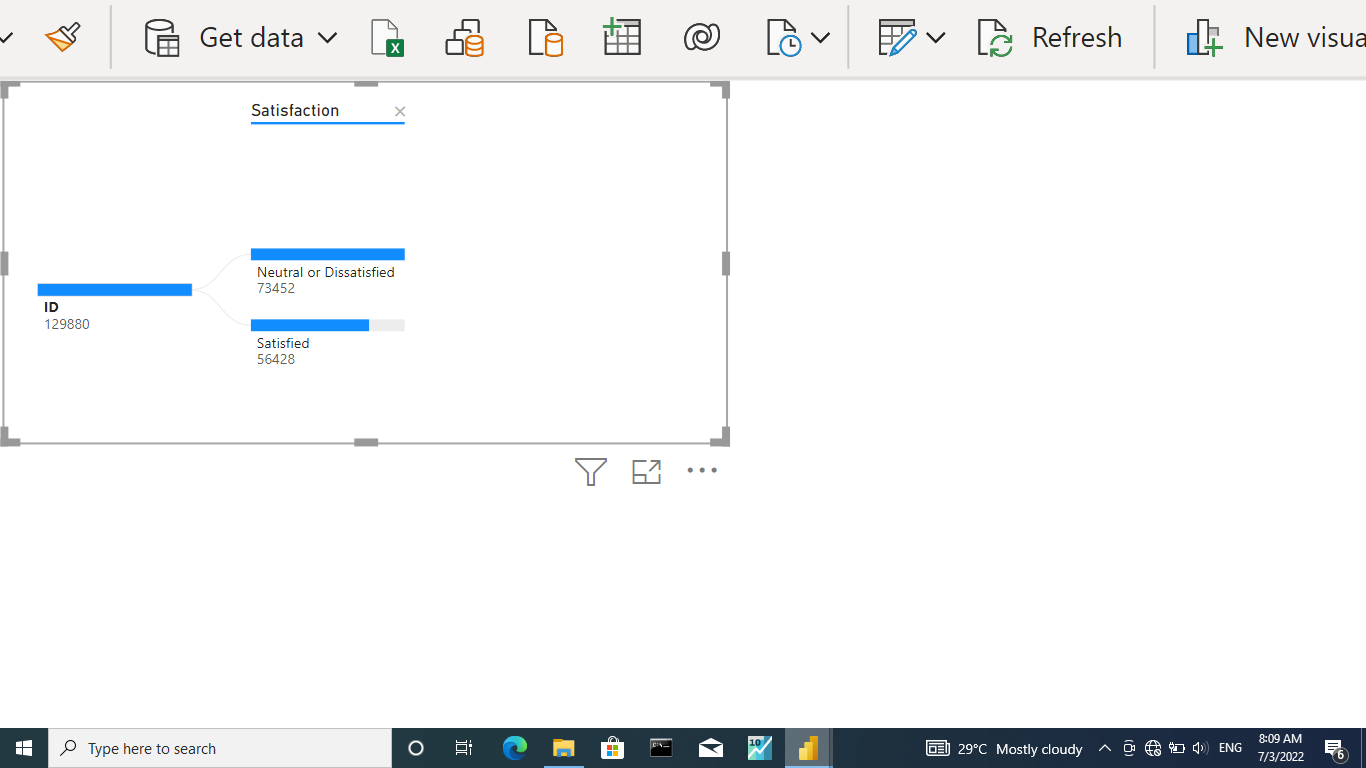
Note : out of 129880 respondents, 56428 were satisfied while 73452 were dissatisfied
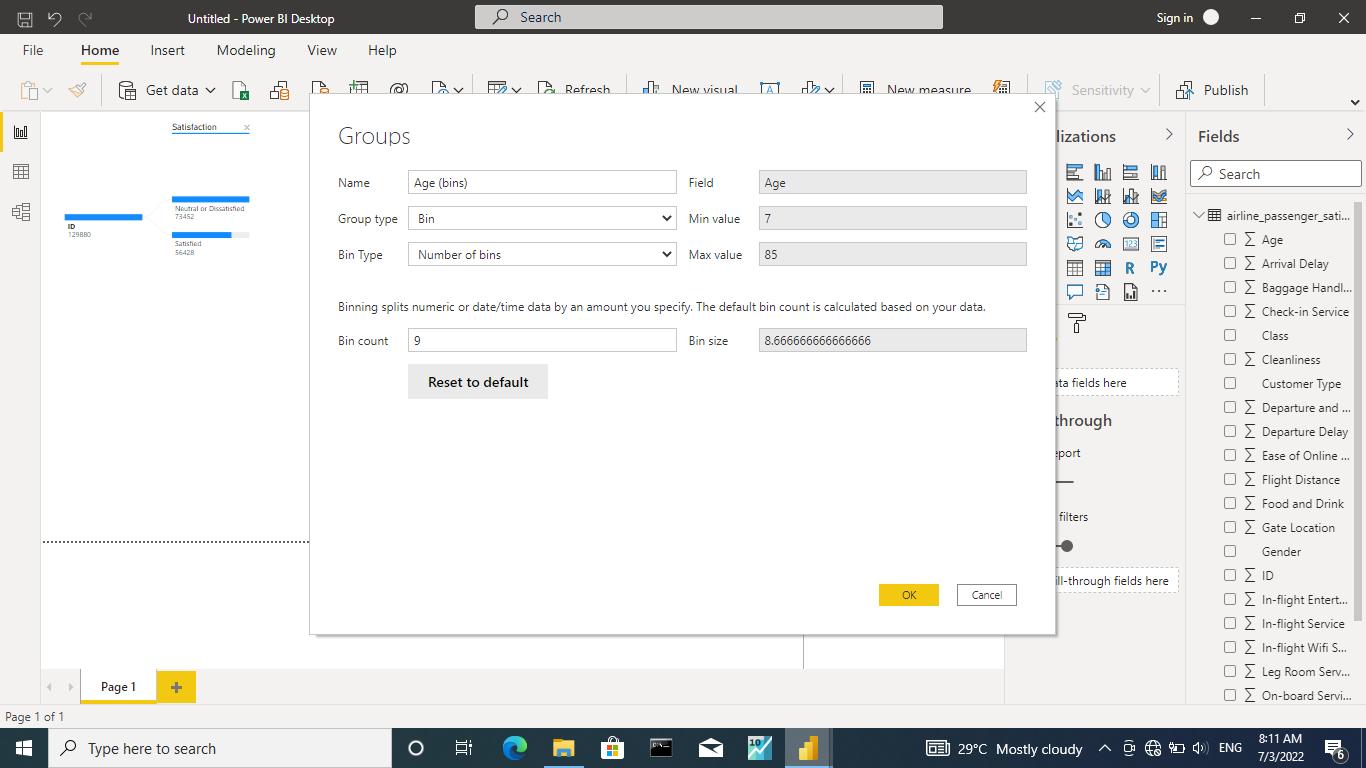
Step 4 : we created a bin for age and visualized using stacked column chart by showing the "age range by satisfaction "
Note : To create a bin right click on the age and select group then you set the bin type to "Number of bins " and bin count "9" also note that we changed the age values from sum to count
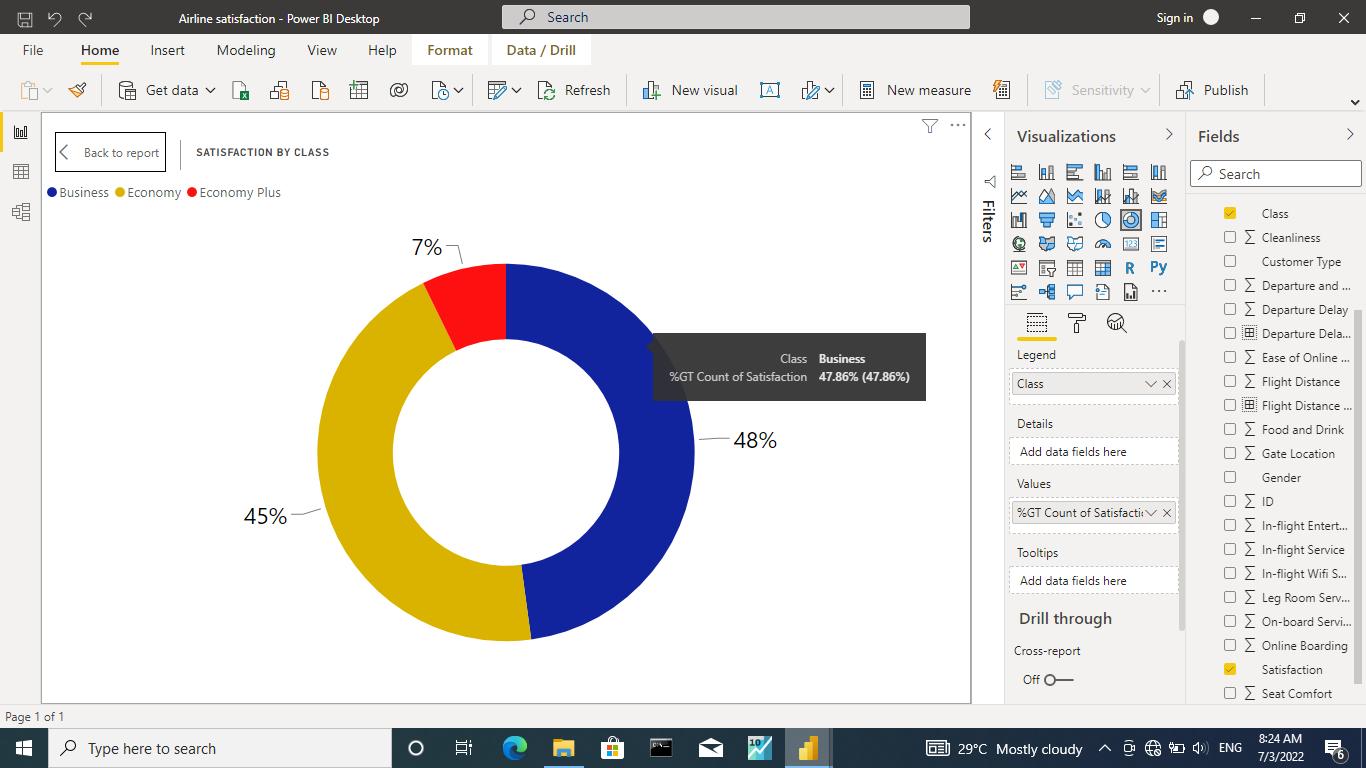
Step 5 : we created a doughnut chart which shows the satisfaction by class
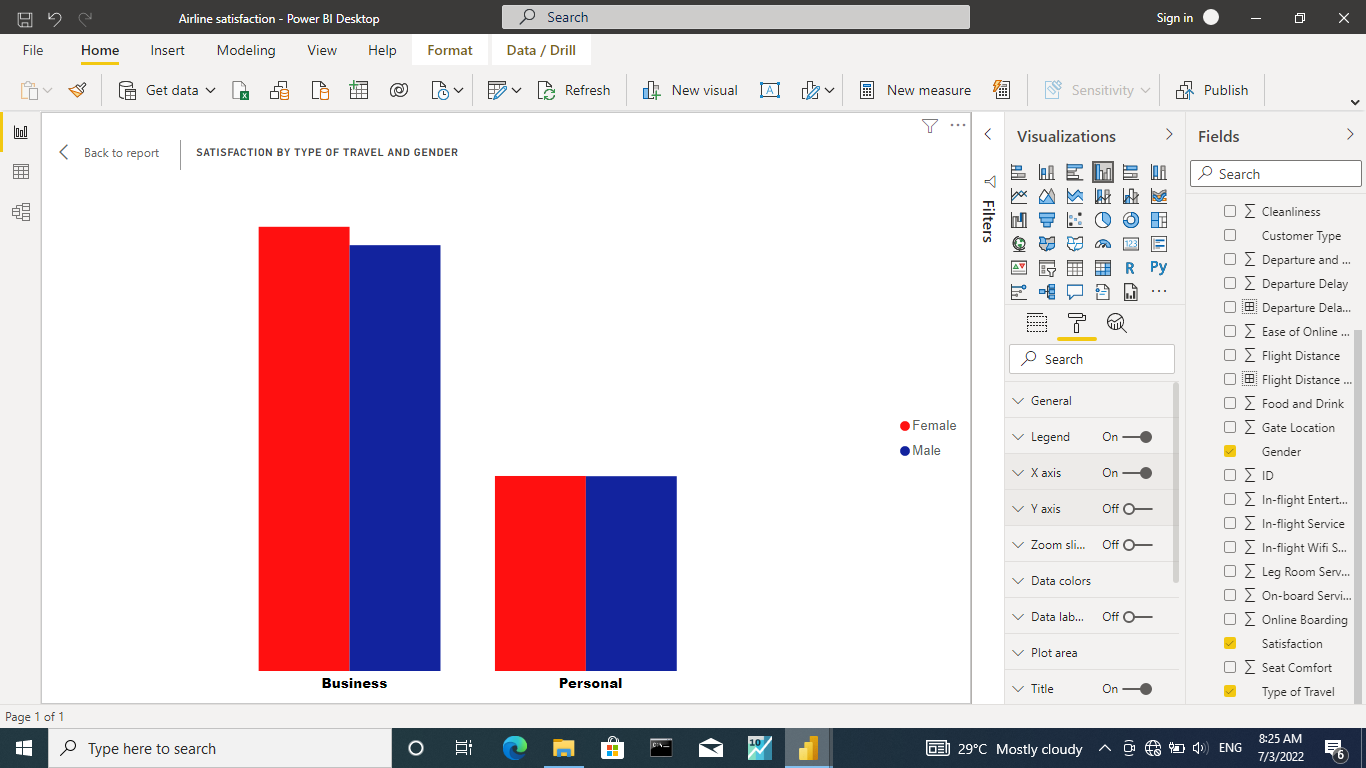
Step 6 : we also created a column chart which shows the satisfaction by type of travel and gender
Step 7 : created a column chart which shows the average rate of each airline services
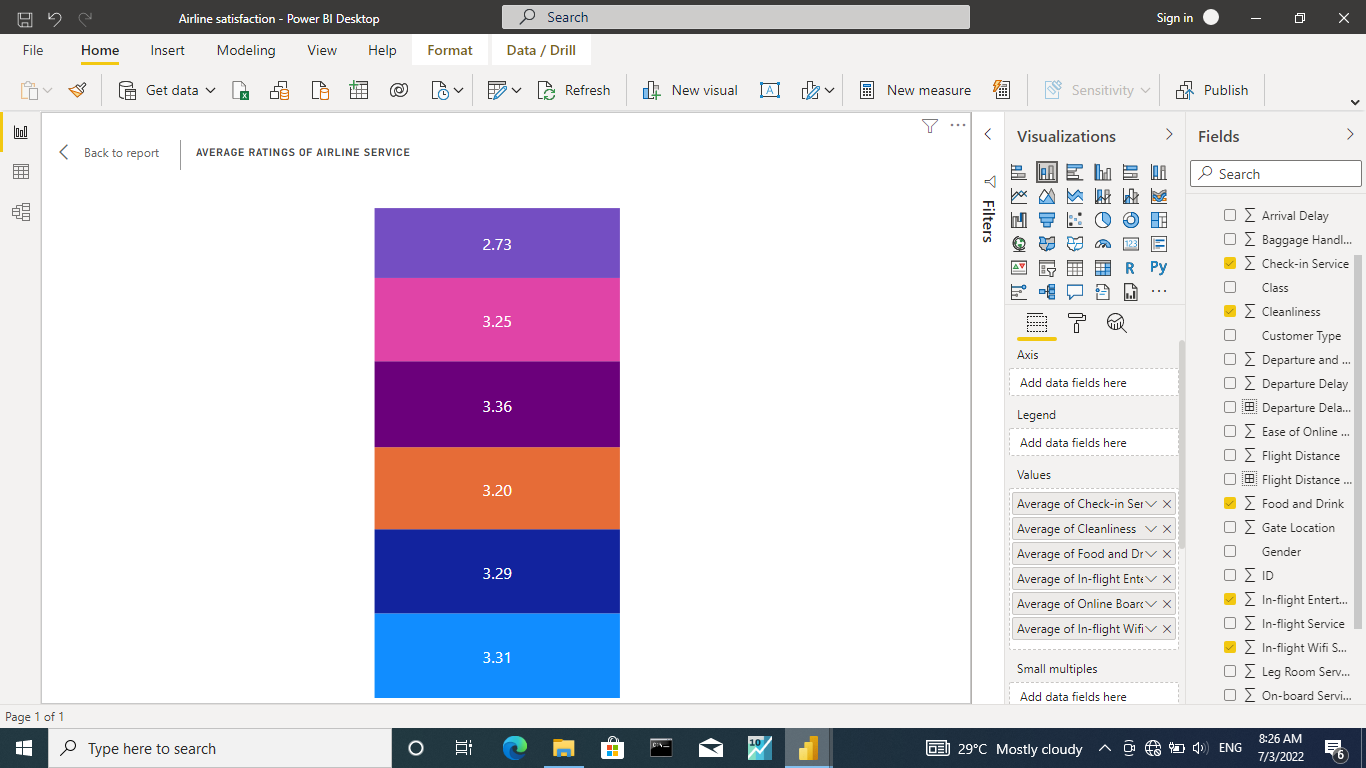
Dashboard
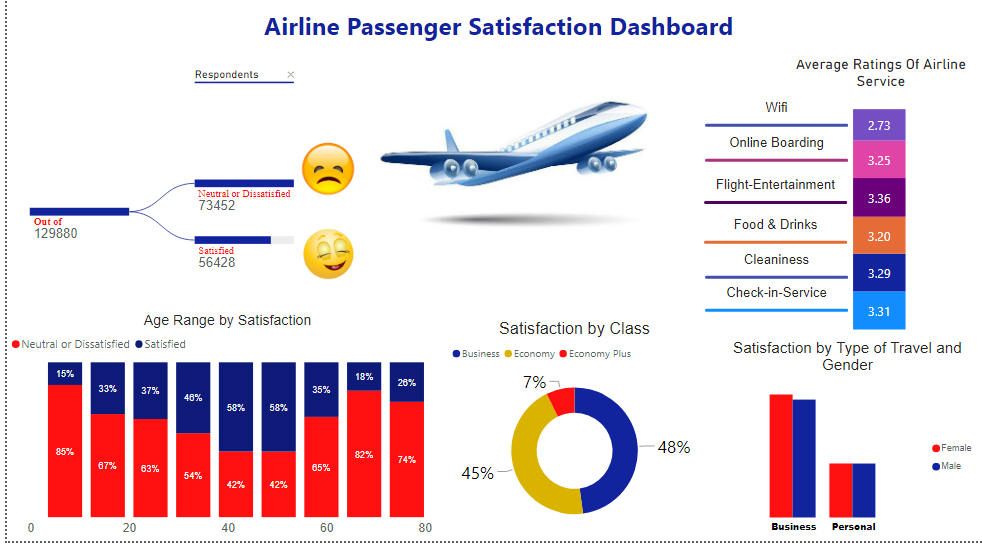
Observations :
1 - we observed that ages between 41 - 49 are more satisfied
2 - we noticed that the business class passengers derived more satisfaction 3 - it was also observed that the wifi airline services has the lowest average
4 - lastly ,we could see that the female gender are always satisfied while traveling for business or personal purpose
Recommendations
1 - we recommend that the wifi services should be worked on
2 - we also recommended that the airline should make amendments were necessary so the Economy class will derive more satisfaction no matter how much they pay for the ticket


